Start the debugger session启动调试器会话
Any debugger session is based on a run/debug configuration. 任何调试器会话都基于运行/调试配置。The configuration type depends on the type of your application and the runtime environment.配置类型取决于应用程序的类型和运行时环境。
You can run several debugger sessions with different configurations at a time.一次可以使用不同的配置运行多个调试器会话。
Through a configuration you do not only launch your application but can also tell WebStorm to use some parameters or perform some actions before the application starts. 通过配置,您不仅可以启动应用程序,还可以告诉WebStorm在应用程序启动之前使用一些参数或执行一些操作。For example, you can pass Node.js-specific command line options to the Node.js executable file.例如,可以将Node.js专用的命令行选项传递给Node.js可执行文件。
Before debugging调试前
-
Set the breakpoints in your code.在代码中设置断点。 -
To debug code compiled to JavaScript, you need to generate a source map for it.要调试编译为JavaScript的代码,需要为其生成源映射。This will set the correspondence between lines in your original code and in the generated JavaScript code.这将设置原始代码和生成的JavaScript代码中的行之间的对应关系。If no source map is generated, your breakpoints will not be recognized and processed correctly.如果未生成源映射,将无法正确识别和处理断点。Source maps are required for debugging TypeScript, Dart, CoffeeScript, JavaScript with JSX, ES6 and newer versions etc.调试TypeScript、Dart、CoffeeScript、JSX、ES6和更新版本的JavaScript等都需要源映射。
Start debugging开始调试
-
Select the required configuration from the Select run/debug configuration list on the toolbar and click从工具栏上的“选择运行/调试配置”列表中选择想要的配置,并点击列表后面的 next to the list.。
-
If your application consists of an HTML file with a reference to JavaScript code and the application is running on the built-in server, just open this HTML file or select it in the Project tool window and then select Debug <HTML_file_name> from the context menu.如果应用程序由一个引用JavaScript代码的HTML文件组成,并且应用程序正在内置服务器上运行,只需打开此HTML文件或在“项目”工具窗口中选择它,然后从上下文菜单中选择“调试”<HTML_file_name>。WebStorm generates a temporary debug configuration and starts a debugging session through it.WebStorm生成一个临时调试配置,并通过它启动调试会话。
-
If your application is running in the development mode on如果应用程序在本地主机上以开发模式运行,则可以从内置“终端”(Alt+F12)、“运行”工具窗口或“调试”工具窗口开始调试。localhost, you can start debugging it from the built-in Terminal(Alt+F12), from the Run tool window, or from the Debug tool window.Just hold Ctrl+Shift and click the URL at which the application is running.只需按住Ctrl+Shift并单击应用程序运行的URL。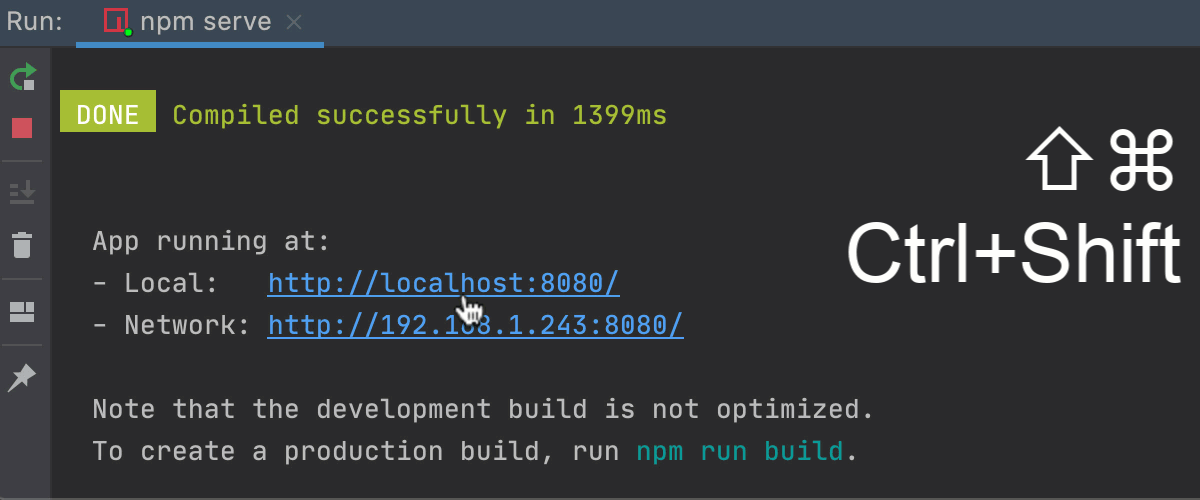
Learn more from Debug a Vue.js application, Debug an Angular application, and Debug a React application.通过调试Vue.js应用程序、调试Angular应用程序和调试React应用程序了解更多信息。 -
You can also attach the debugger to a running Node.js application from the built-in Terminal(Alt+F12) or from the Run tool window.您还可以从内置“终端”(Alt+F12)或“运行”工具窗口将调试器附加到正在运行的Node.js应用程序。To start debugging, hold Ctrl+Shift and click the URL link in the information message要开始调试,请按住Ctrl+Shift并单击信息消息Debugger listening <host>:<port>.Debugger listening <host>:<port>。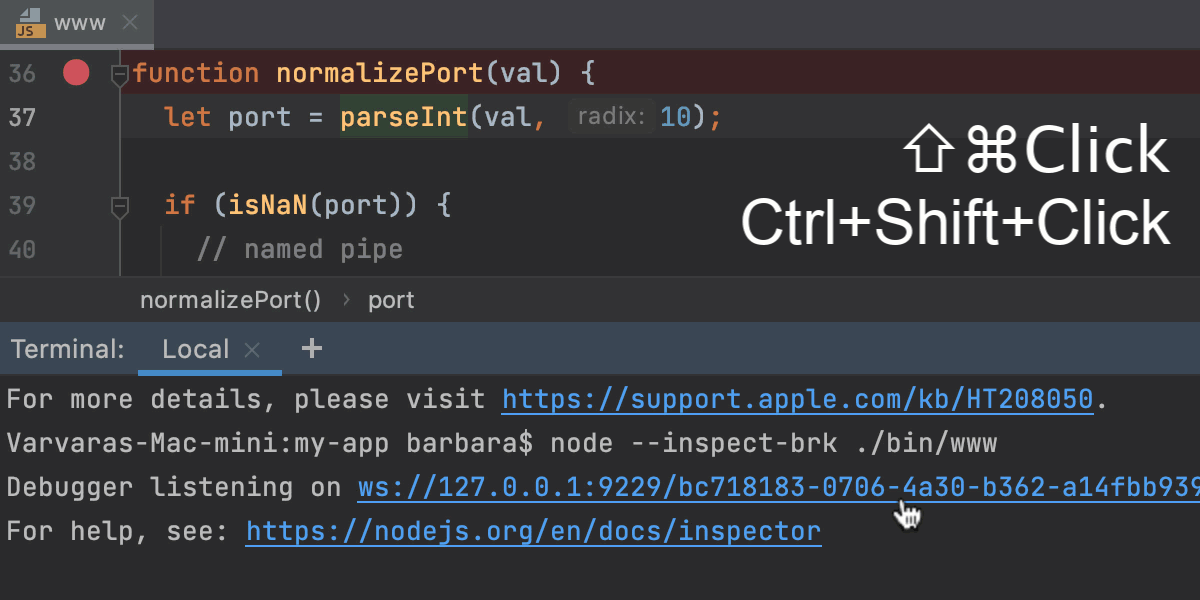
Learn more from Debugging a running Node.js application.通过调试正在运行的Node.js应用程序了解更多信息。
Note that after you launch a debugger session, the 请注意,启动调试器会话后,标记“调试”工具窗口的![]() icon that marks the Debug Tool Window toggles to
icon that marks the Debug Tool Window toggles to ![]() to indicate that the debugging process is active.
to indicate that the debugging process is active.![]() 图标将切换到
图标将切换到![]() 以指示调试过程处于活动状态。
以指示调试过程处于活动状态。
Pause/Resume a debugger session暂停/恢复调试器会话
When the debugger session is running, you can pause/resume it as required using the buttons on the toolbar of the Debug tool window:调试器会话运行时,可以根据需要使用“调试”工具窗口工具栏上的按钮暂停/恢复该会话:
-
To pause a debugger session, click要暂停调试器会话,请单击 .。
.。 -
To resume a debugger session, click要恢复调试器会话,请单击 F9.F9。
Restart a debugger session重新启动调试器会话
-
Click the Rerun button in the Debug tool window or press Ctrl+F5.单击“调试”工具窗口中的“重新运行”按钮或按Ctrl+F5。
Terminate a debugger session终止调试器会话
-
Click the Stop button in the Debug tool window.单击“调试”工具窗口中的“停止”按钮。Alternatively, press Ctrl+F2 and select the process to terminate (if there are two or more of them).或者,按Ctrl+F2并选择要终止的进程(如果有两个或多个进程)。
Productivity tips生产力提示
Debug non-responding applications调试无响应的应用程序In case your application hung, pause the session to let the debugger get the information about its current state.如果应用程序挂起,请暂停会话,让调试器获取有关其当前状态的信息。You can then examine the program state and locate the cause of the problem.然后可以检查程序状态并找到问题的原因。Do more with pause多做些暂停When you need to evaluate an expression, and WebStorm doesn't let you do that because you didn't stop at a breakpoint, you can advance your program a line further by stepping.当您需要对表达式求值时,WebStorm不允许您这样做,因为您没有在断点处停止,您可以通过“单步执行”将程序向前推进一行。After this, you will be able to use the debugger as if you had stopped at a breakpoint.在此之后,您将能够像在断点处停止一样使用调试器。While in some cases this may not be a valid solution, it may sometimes help you out.虽然在某些情况下,这可能不是一个有效的解决方案,但有时它可能会帮助您。Run before-launch tasks启动前运行任务Configure running external tools or performing other actions before every debugging session.在每次调试会话之前配置运行外部工具或执行其他操作。This before-launch task can be running a Gulp or Grunt task or an NPM script, compiling your TypeScript code into JavaScript or running all the currently active File Watchers to compile or compress your code, uploading your sources to a remote server, and many more, depending on the language and frameworks you are using.此启动前任务可以运行Gulp或Grunt任务或NPM脚本,将TypeScript代码编译为JavaScript,或运行所有当前活动的文件查看器来编译或压缩代码,将源代码上载到远程服务器,等等,具体取决于您使用的语言和框架。