Debug tool window调试工具窗口
When you start a debugger session, WebStorm opens the Debug tool window where you can perform various debugger actions and analyze the program data (frames, threads, variables, and so on).启动调试器会话时,WebStorm会打开“调试”工具窗口,您可以在其中执行各种调试器操作并分析程序数据(帧、线程、变量等)。
For a detailed description of controls, see Debug tool window.有关控件的详细说明,请参阅调试工具窗口。
For general instructions on using tool windows, refer to Tool windows.有关使用工具窗口的一般说明,请参阅工具窗口。

By default, the Debug tool window only appears when your program hits a breakpoint and stays after the debug session is terminated. 默认情况下,“调试”工具窗口仅在程序遇到断点并在调试会话终止后保持不变时显示。To change this behavior, open the Settings/Preferences dialog Ctrl+Alt+S, go to , and select the Hide Debug window on process termination checkbox.要更改此行为,请打开“设置/首选项”对话框Ctrl+Alt+S,转到“生成、执行、部署”|“调试器”,然后选中“在进程终止时隐藏调试窗口”复选框。
Sessions会话
The available debug sessions are shown in separate tabs in the top part of the Debug tool window. 可用的调试会话显示在“调试”工具窗口顶部的单独选项卡中。When you close a tab, the corresponding session terminates.关闭选项卡时,相应的会话将终止。

All the information like inline variable values and execution point is shown for the selected session tab. 为所选会话选项卡显示所有信息,如内联变量值和执行点。This is important if you are running several debug sessions in parallel that use the same code.如果要并行运行多个使用相同代码的调试会话,这一点很重要。
Tabs标签
For each session, the Debug tool window shows the following tabs and panes:对于每个会话,“调试”工具窗口显示以下选项卡和窗格:
-
Frames帧: use this pane to navigate in call stacks and switch between threads when debugging a multiprocess Node.js application or Service Workers.:调试多进程Node.js应用程序或服务工作者时,使用此窗格在调用堆栈中导航并在线程之间切换。
-
Variables变量: the pane lists the variables available in the current context and lets you analyze and modify the program state.:窗格列出当前上下文中可用的变量,并允许您分析和修改程序状态。 -
Watches监视: the pane lets you manage watches.:允许您管理监视的窗格。By default, watches are shown on the Variables tab for more efficient use of the screen space.默认情况下,监视显示在“变量”选项卡上,以便更有效地使用屏幕空间。If you have a lot of watches, consider viewing them in a separate tab.如果你有很多监视,请考虑在一个单独的标签中查看它们。 -
Console控制台: displays stacktraces.:显示堆栈跟踪。For client-side applications, the tab also shows everything that was logged in your code (for example, using
console.*) and behaves also as a read-eval-print loop(REPL) so you can run JavaScript code snippets in it and interact with the page that you are currently debugging. Learn more from Interactive debugger console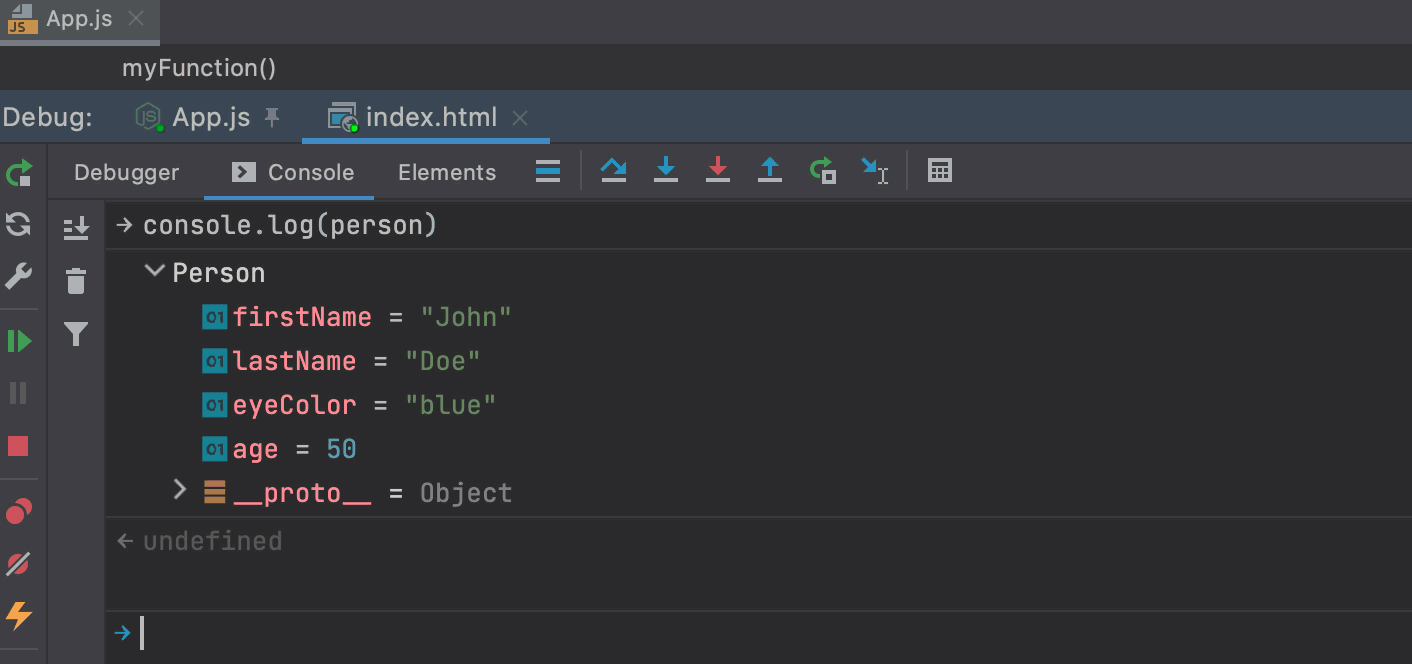
-
Process Console: WebStorm opens this tab when you are debugging a Node.js application. The tab shows the output of the node process itself, that is, everything that is written to process.stdout and process.stderr directly or is logged using console.*. Learn more from Using interactive Debugger Console.

-
Debugger console: WebStorm opens this tab when you are debugging a Node.js application. Here you can run JavaScript code snippets and view the console.* messages.

Learn more from Using interactive Debugger Console.通过使用交互式调试器控制台了解更多信息。 -
Scripts
: during a JavaScript debugging session, the tab shows all the external resources that are automatically downloaded during the JavaScript code execution.:在JavaScript调试会话期间,该选项卡显示在JavaScript代码执行期间自动下载的所有外部资源。Use this tab to monitor downloading the external resources. To open the code of a resource in the editor, double-click the item in question.使用此选项卡监视外部资源的下载。要在编辑器中打开资源的代码,请双击有问题的项。 -
Elements: this tab shows the actual HTML source code and the HTML DOM structure of the active browser page. Use the tab to monitor the changes made to the page through the browser.
The tab is available only when you are debugging client-side code.
Show/hide tabs显示/隐藏选项卡
-
Click
 and select which tabs you want to see.
Move tabs移动选项卡
You can arrange the tabs to fit your preference. You can move a tab to another location or group a tab with another tab, so that they share the same space on the screen.
-
Drag the tab header to the desired location.将选项卡标题拖动到所需位置。The blue frame indicates the destination.蓝色框表示目的地。
Restore default layout恢复默认布局
If you changed the layout of the Debug tool window and don't like the new arrangement, you can revert it to the default state.
-
Click
in the top-right corner of the Debug tool window, then click Restore Default Layout.