View Query Performance查看查询性能
On this page
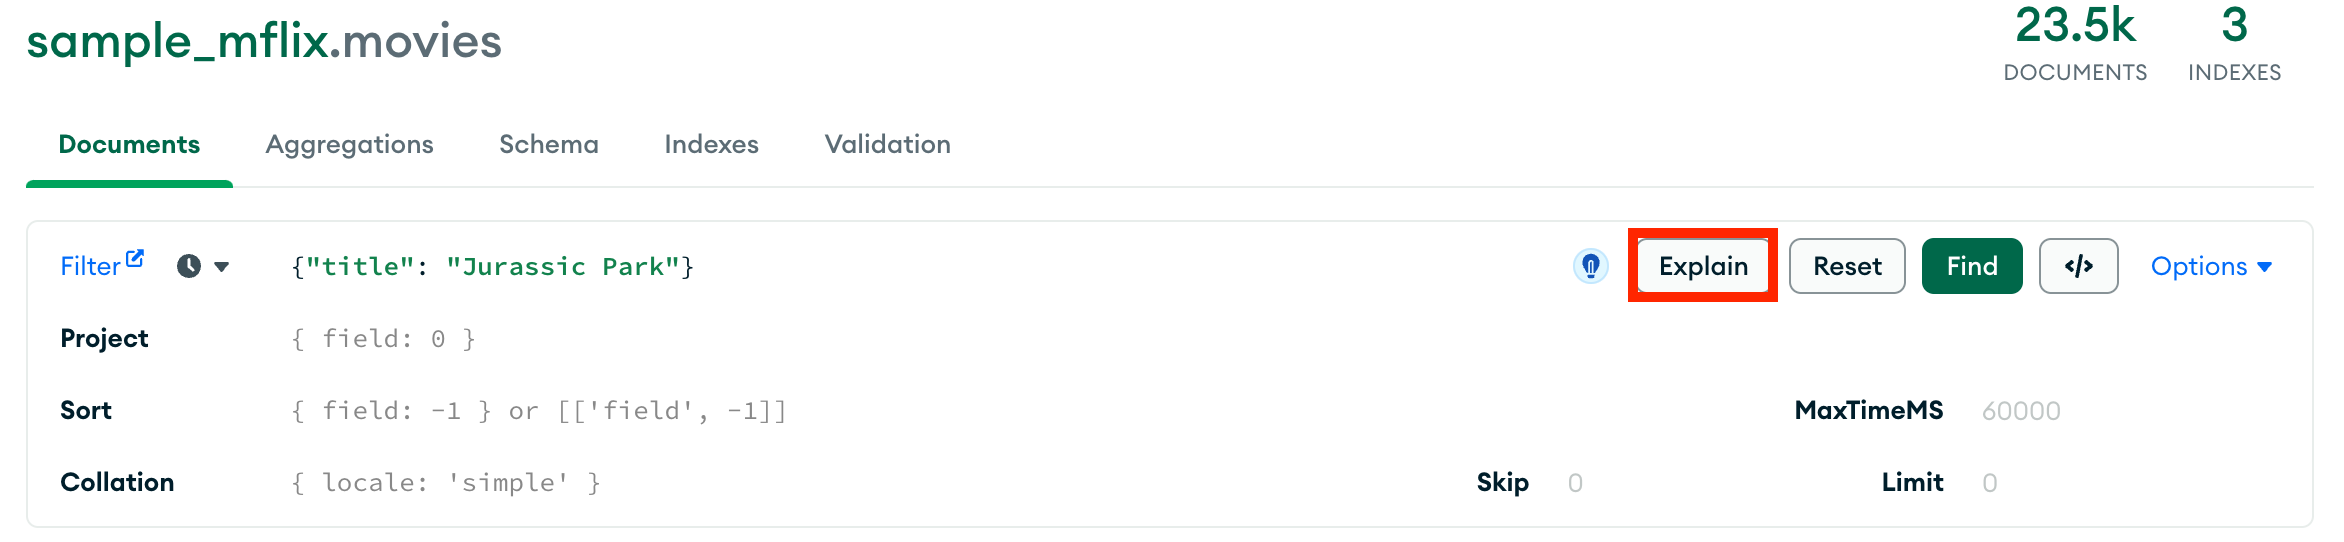
The Explain Plan tab displays the execution plan for a query.“解释计划”选项卡显示查询的执行计划。
To view the execution plan for a query filter, click on the collection on the left hand pane, then click Explain Plan.要查看查询筛选器的执行计划,请单击左侧窗格上的集合,然后单击解释计划。
Visual Tree视觉树
You can view the explain stages in a tree format. Each stage of the pipeline appears as a node on the tree. 您可以以树格式查看解释阶段。管道的每个阶段在树上显示为一个节点。This makes sharded cluster outputs easier to understand and visualize.这使得分片集群输出更易于理解和可视化。

Raw JSON原始JSON
You can also view the explain details in raw JSON format:您还可以查看原始JSON格式的解释详细信息:

To learn more about execution plans, see the MongoDB documentation.要了解有关执行计划的更多信息,请参阅MongoDB文档。
Limitations局限性
The Explain Plan tab is not available if you are connected to Data Lake.如果连接到数据湖,“解释计划”选项卡不可用。The Explain Plan tab is not available for aggregation commands.“解释计划”选项卡不适用于聚合命令。Instead, you can utilize the .explain() method from Embedded MongoDB Shell in Compass.相反,您可以利用Compass中嵌入的MongoDB Shell中的.explain()方法。