Run and debug a Spring Boot application using Docker Compose
You can use IntelliJ IDEA to run and debug a Spring Boot application running in multiple Docker containers under Docker Compose. This tutorial describes how to run two Docker Compose services inside containers: a simple Spring Boot application and a MySQL database. The application can receive GET requests that add entries to the database. This tutorial also describes how you can set breakpoints and debug your application using a remote debug configuration.
Clone the sample project
The source code of the application is hosted on GitHub at https://github.com/IdeaUJetBrains/SpringBootDockerDemoDebug
-
From the main menu, select
-
Specify the URL of the repository and click Clone.
-
Agree to open the cloned project in a new window.
Run the application using Docker Compose
-
Open the docker-compose-debug.yml file.
-
Click
in the gutter.
This creates a Docker Compose run configuration, which starts the application in a container as the app service and the database in another container as the db service. If successful, you should see something similar to the following in the deploy log:
Creating db ... Creating springbootdockerdemodebug_app_1 ... 'Compose: docker-compose-debug.yml' has been deployed successfully.You can access the application at http://localhost:18080. For example, you can try to execute the following GET request, which should add a new
entitybusentry to the database and list all available entries: http://127.0.0.1:18080/entitybus/post.You can connect to the database at jdbc:mysql://0.0.0.0:13306/DOCKERDB. Use the Database tool window to add the database as a data source and check the
entitybustable. Use the following connection settings:-
Host:
0.0.0.0orlocalhost -
Port:
13306 -
User:
root -
Password:
root -
Database:
DOCKERDB
-
Create a remote debug configuration
-
Open the docker-compose-debug.yml file.
-
Click
in the gutter.
-
Select the module in the Use module classpath list.
-
Double-click the Docker Compose run configuration in the Before launch list. If it is not in the list, click
and select Launch Docker before debug.
-
Make sure that the Docker Compose run configuration is selected with the app service. Also check the Custom Command field: it should contain the
-agentliboption and options from thecommandfield in the docker-compose-debug.yml file:java -agentlib:jdwp=transport=dt_socket,server=y,suspend=y,address=5005 -Djava.security.egd=file:/dev/./urandom -jar /project/target/demo-0.0.1-SNAPSHOT.jar
If the application is already running, do not run the debug configuration. Apply the settings and click Cancel.
Launch the debug configuration
-
If the application is already running, stop it. To do it, select the Docker Compose node in the Services tool window and click
in the toolbar. Alternatively, you can right-click and delete the containers under the corresponding services.
-
Open the docker-compose-debug.yml file.
-
Click
in the gutter and start the debug configuration.
Once the application starts and the debugger attaches to it, the Debug tool window will open.
Set a breakpoint and debug the application
-
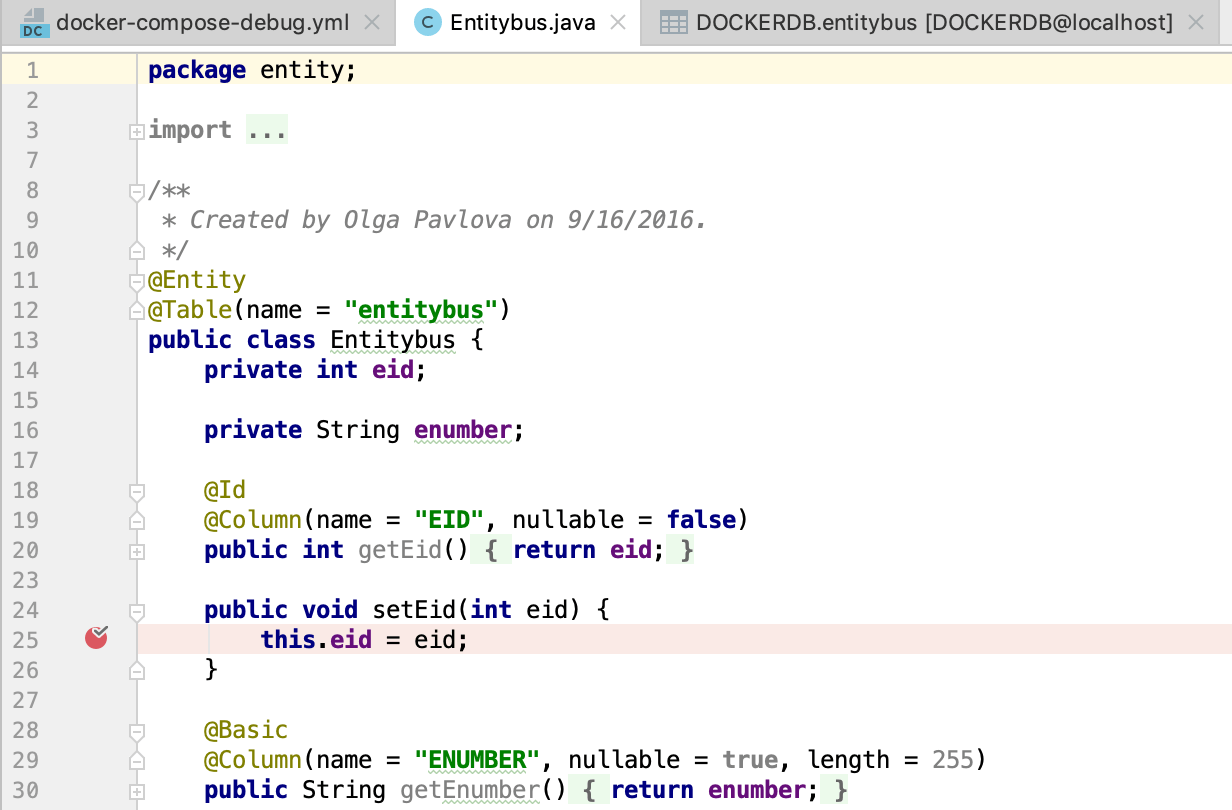
Open the src/main/java/entity/Entitybus.java file and set a breakpoint in the
setEid()method.
-
Execute the following GET request: http://127.0.0.1:18080/entitybus/post
The application will stop at the breakpoint and you can examine the current variable values and frames in the Debug tool window.
-
Click
until it executes the request and you get the returned values.