JavaScript linters
IntelliJ IDEA integrates with ESLint and other most popular JavaScript code linters that detect problems in your code without executing it.
When installed and enabled, a linter activates automatically every time you open a JavaScript file, reports detected errors and warnings, and suggests quick-fixes where possible.
Descriptions of the errors detected in the current file and quick-fixes for them are available from the editor and from the Current File tab of the Problems tool window.
Errors in all previously opened files and quick-fixes for them are shown in the Project Errors tab of the Problems tool window. To open the tool window, click the Inspection widget in the upper-right corner of the editor:
See View problems and apply quick-fixes in the editor and Problems tool window for details.
View problems and apply quick-fixes in the editor
-
In the editor, hover the mouse pointer over the highlighted problem. IntelliJ IDEA shows a tooltip with a description of the problem.

To resolve the problem, click <Linter name>: Fix '<rule name>' or press Alt+Shift+Enter.
-
To resolve all the detected problems in the current file, click More actions(Alt+Enter) and select from the list.

Alternatively, press Alt+Enter and choose the relevant suggestion from the list.
Problems tool window
To open the Problems tool window, click the Inspections widget in the upper-right corner of the editor.
Alternatively select from the main menu or press Alt+6.
The Problems tool window consists of two tabs:
-
The Current File tab shows the errors detected in the file from the active editor tab.

-
The Project Errors tab shows the errors in all previously opened files, with error messages grouped by files in which they were detected.

For each error IntelliJ IDEA shows a brief description and the number of the line where the error occurred. From an error message, you can navigate to the code where the problem occurred, or apply a quick-fix, or fix the problem manually in the Editor Preview pane (![]() ).
).
-
To open the Problems tool window, click the Inspections widget in the upper-right corner of the editor.

Alternatively select from the main menu or press Alt+6.
-
To view suggested quick-fixes for a problem, select the corresponding error message and then select Show Quick Fixes from its context menu, or click
 on the toolbar, or just press Alt+Enter.
To fix a problem, select the appropriate quick-fix from the list.

-
Alternatively, click
 to open the Editor Preview pane and fix the problem manually there, without leaving the tool window.
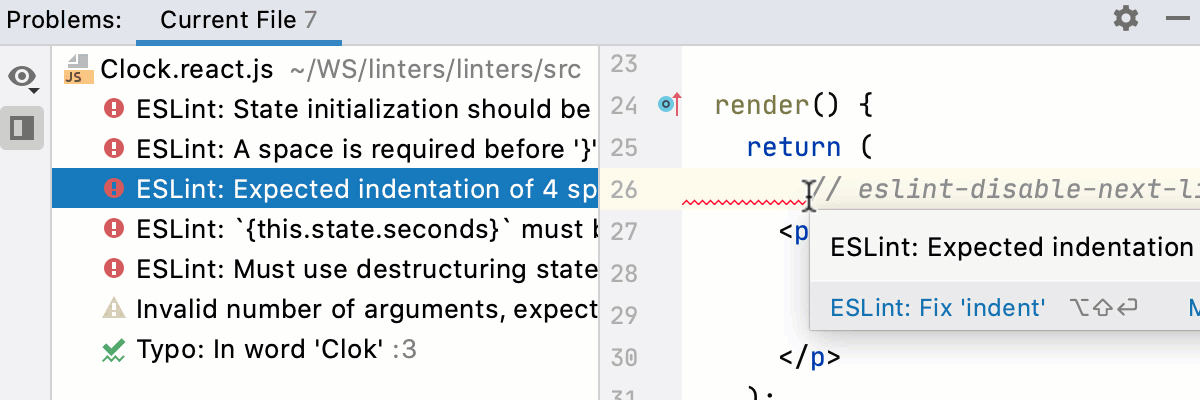
-
To resolve the detected problems in the whole file, select <Linter name >: Fix current file from the context menu.
-
To navigate to the place where an error occurred, double-click the corresponding error message, or select Jump to Source from its context menu, or just press F4.
-
You can also edit the linter's settings, suppress a rule in the statement where a problem occurred or in the whole file, as well as exclude the current file from analysis at all. See Disable and suppress inspections for details.

-
To filter out error messages by their severity and customize their sorting, click
 and select or clear the relevant items in the list.
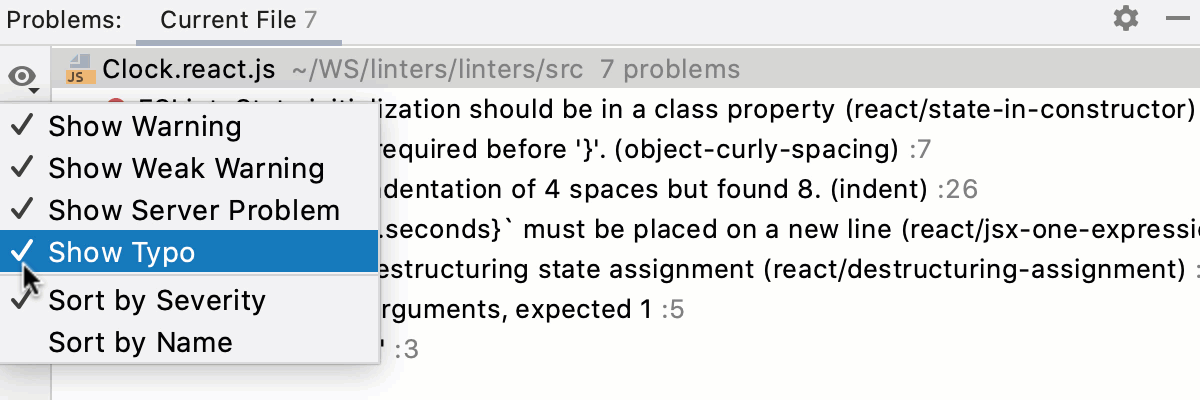
-
To copy an error message, select Copy Problem Description from its context menu or press Ctrl+C.