Exploring Go core dumps
Sometimes when you debug a program, you need to examine the code execution flow and understand the current state of a program. Go core dump is a file that contains the memory dump of running processes and their status during the life of a program. You can debug core dumps when the program finished its execution or while it is still running.
Create a Go core dump file on Linux
-
Open a terminal in the directory with the file .
-
Set the
ulimitparameter tounlimited:ulimit -c unlimited. -
Build the program by running
go build .in the terminal. Thebuildcommand creates a binary file in the current project folder (for example, awesomeProject). -
To create a core dump file, run
GOTRACEBACK=crash ./<binary_file_name>(for example,GOTRACEBACK=crash ./awesomeProject). This command creates a core file in the current project folder.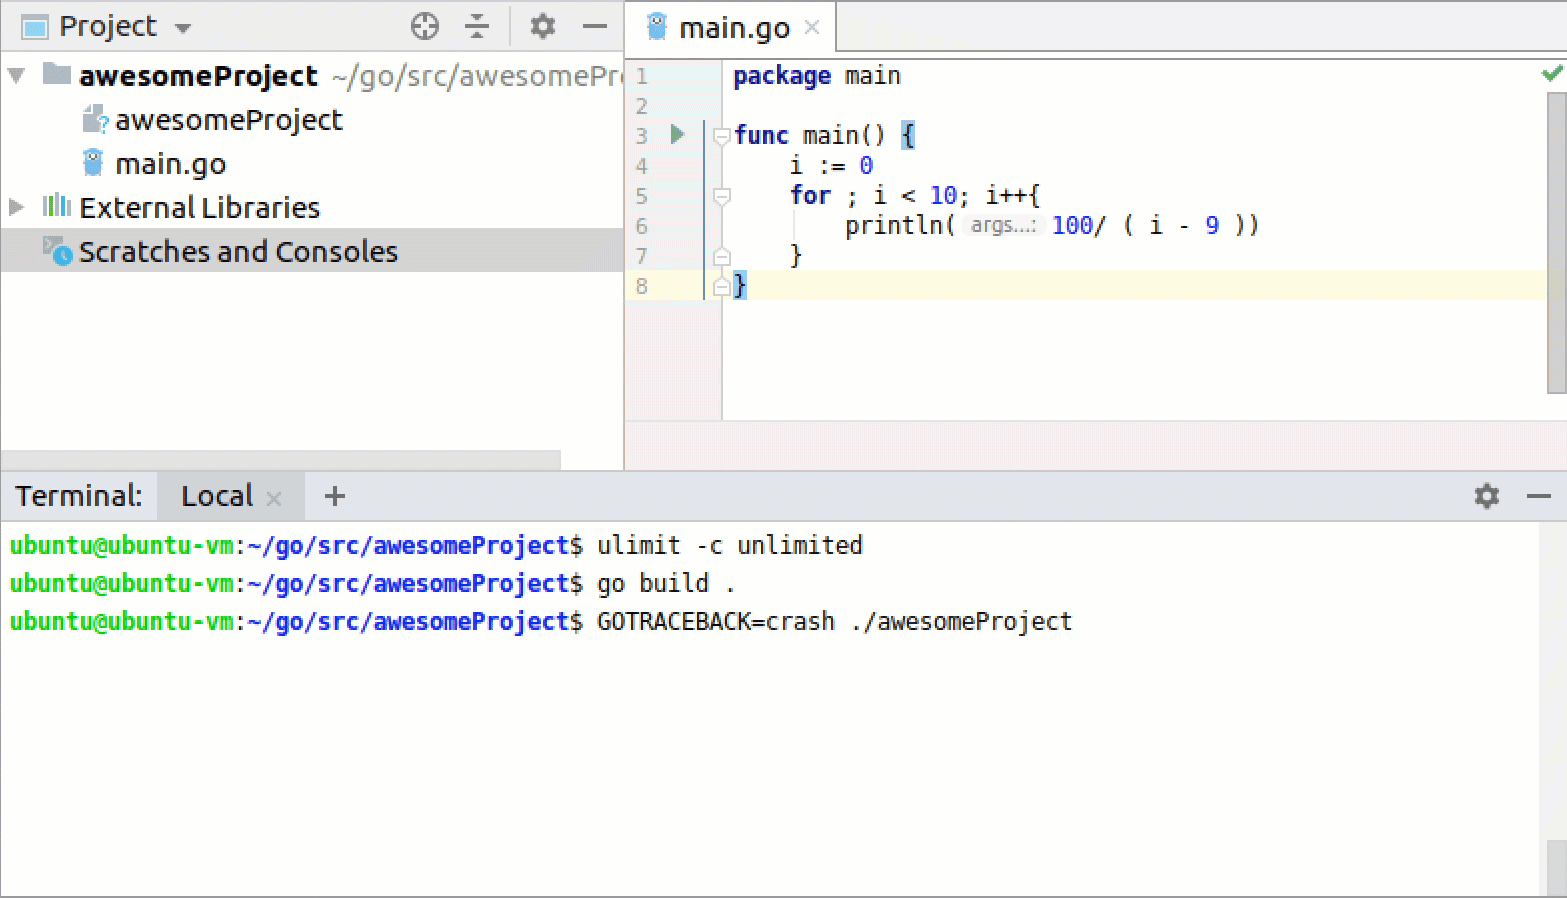
View the dump log
-
Navigate to .
-
In the Executable field, specify a path to the binary file (for example, awesomeProject).
-
In the Core Dump field, specify a path to the
corefile (for example, core). -
Click OK. In the Debug tool window, select a frame that you want to inspect.

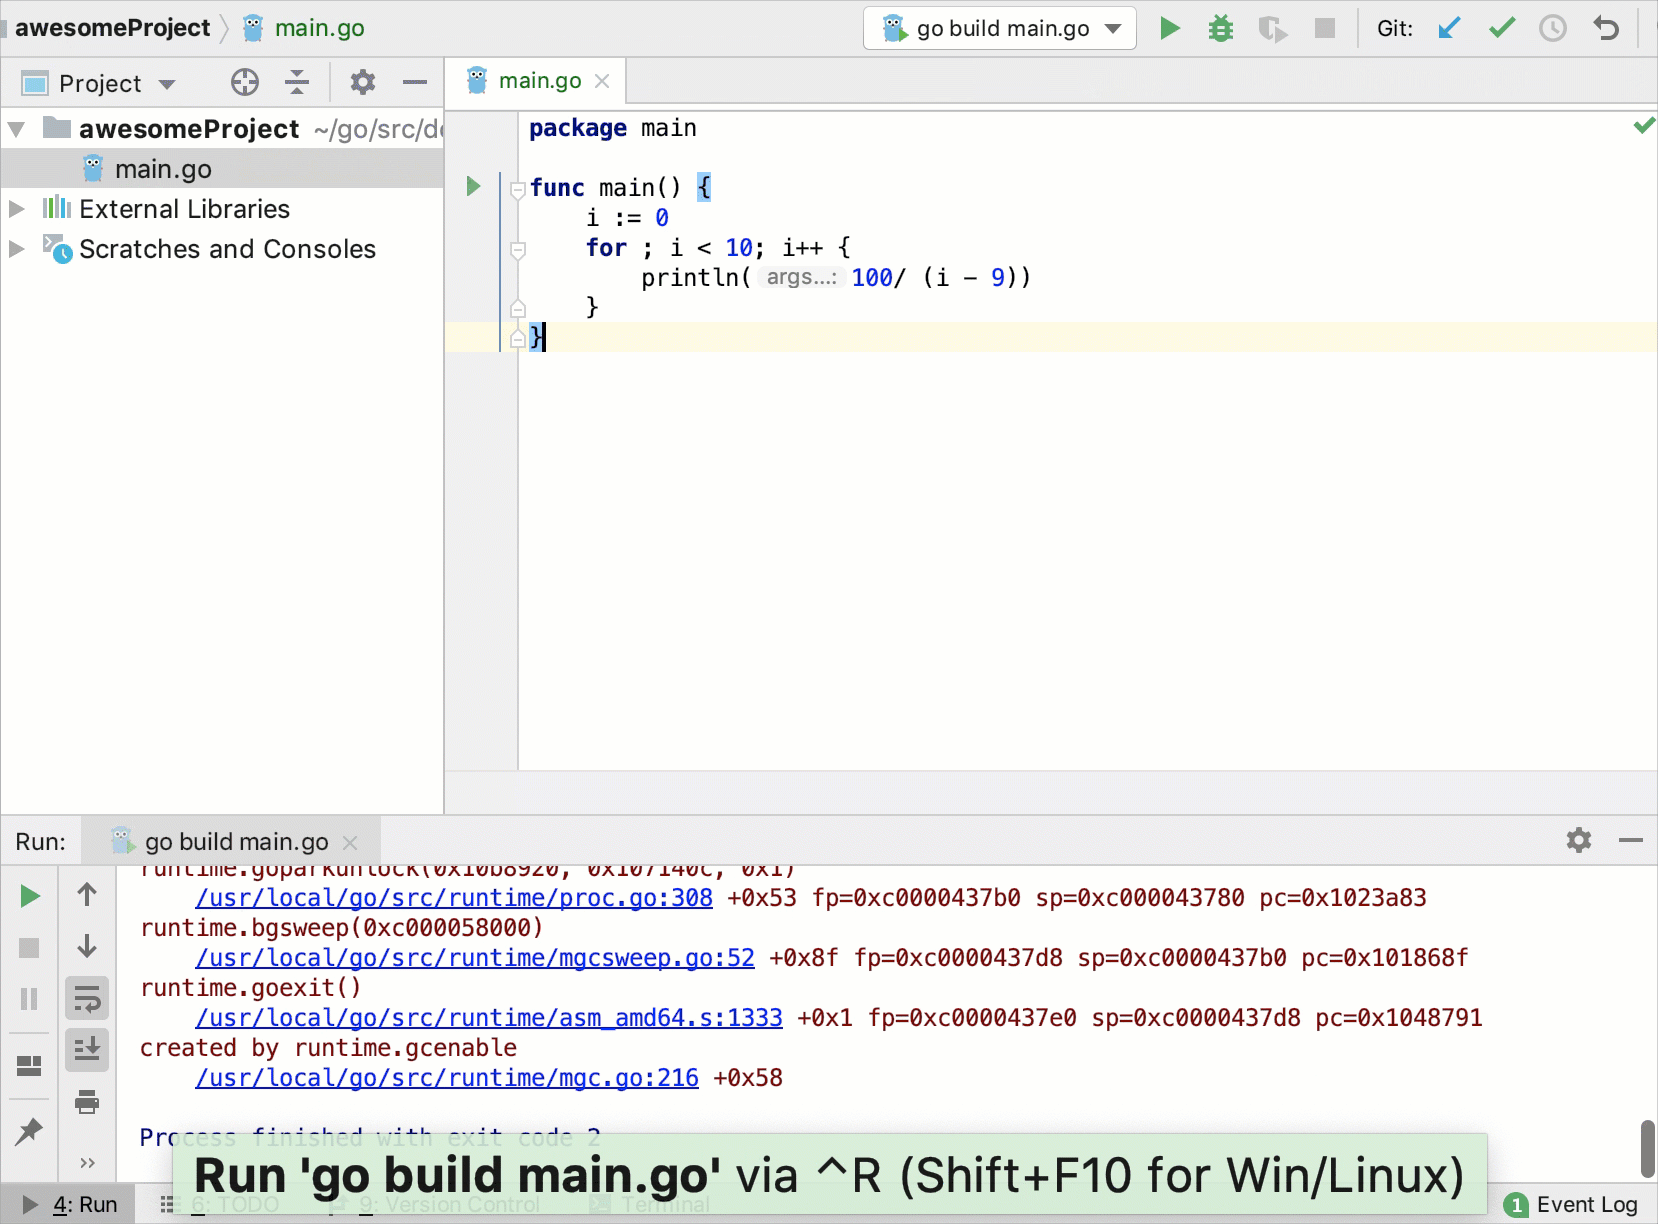
View the Go core dump in IntelliJ IDEA
-
Open or create the Go Build configuration for the Go file.
-
In the Environment field, click the folder (
 ).
). -
In the Environment Variables dialog, click the Add icon (
 ).
). -
Click the Name field and type
GOTRACEBACK. -
Click the Value field and type
crash. -
Save all changes and click OK.
-
Run the program Shift+F10. The output for the program is displayed in the debugger window.